August 2025 Market Snapshots
August brought a tale of two markets in Aspen Snowmass. Aspen slowed sharply, with fewer single-family closings and a pullback in sales volume, though condo price per square foot continued to rise. Snowmass demonstrated greater resilience, as evidenced by stronger single-family activity and sharp price gains in condos, despite fewer overall transactions. Inventory shifted meaningfully year-over-year — Aspen listings remain modestly below last summer and well off pre-pandemic highs, while Snowmass condo supply spiked versus 2024 but is still far leaner than 2019. These dynamics underscore the continued strength of A+ properties and the long-term supply constraints shaping our market.
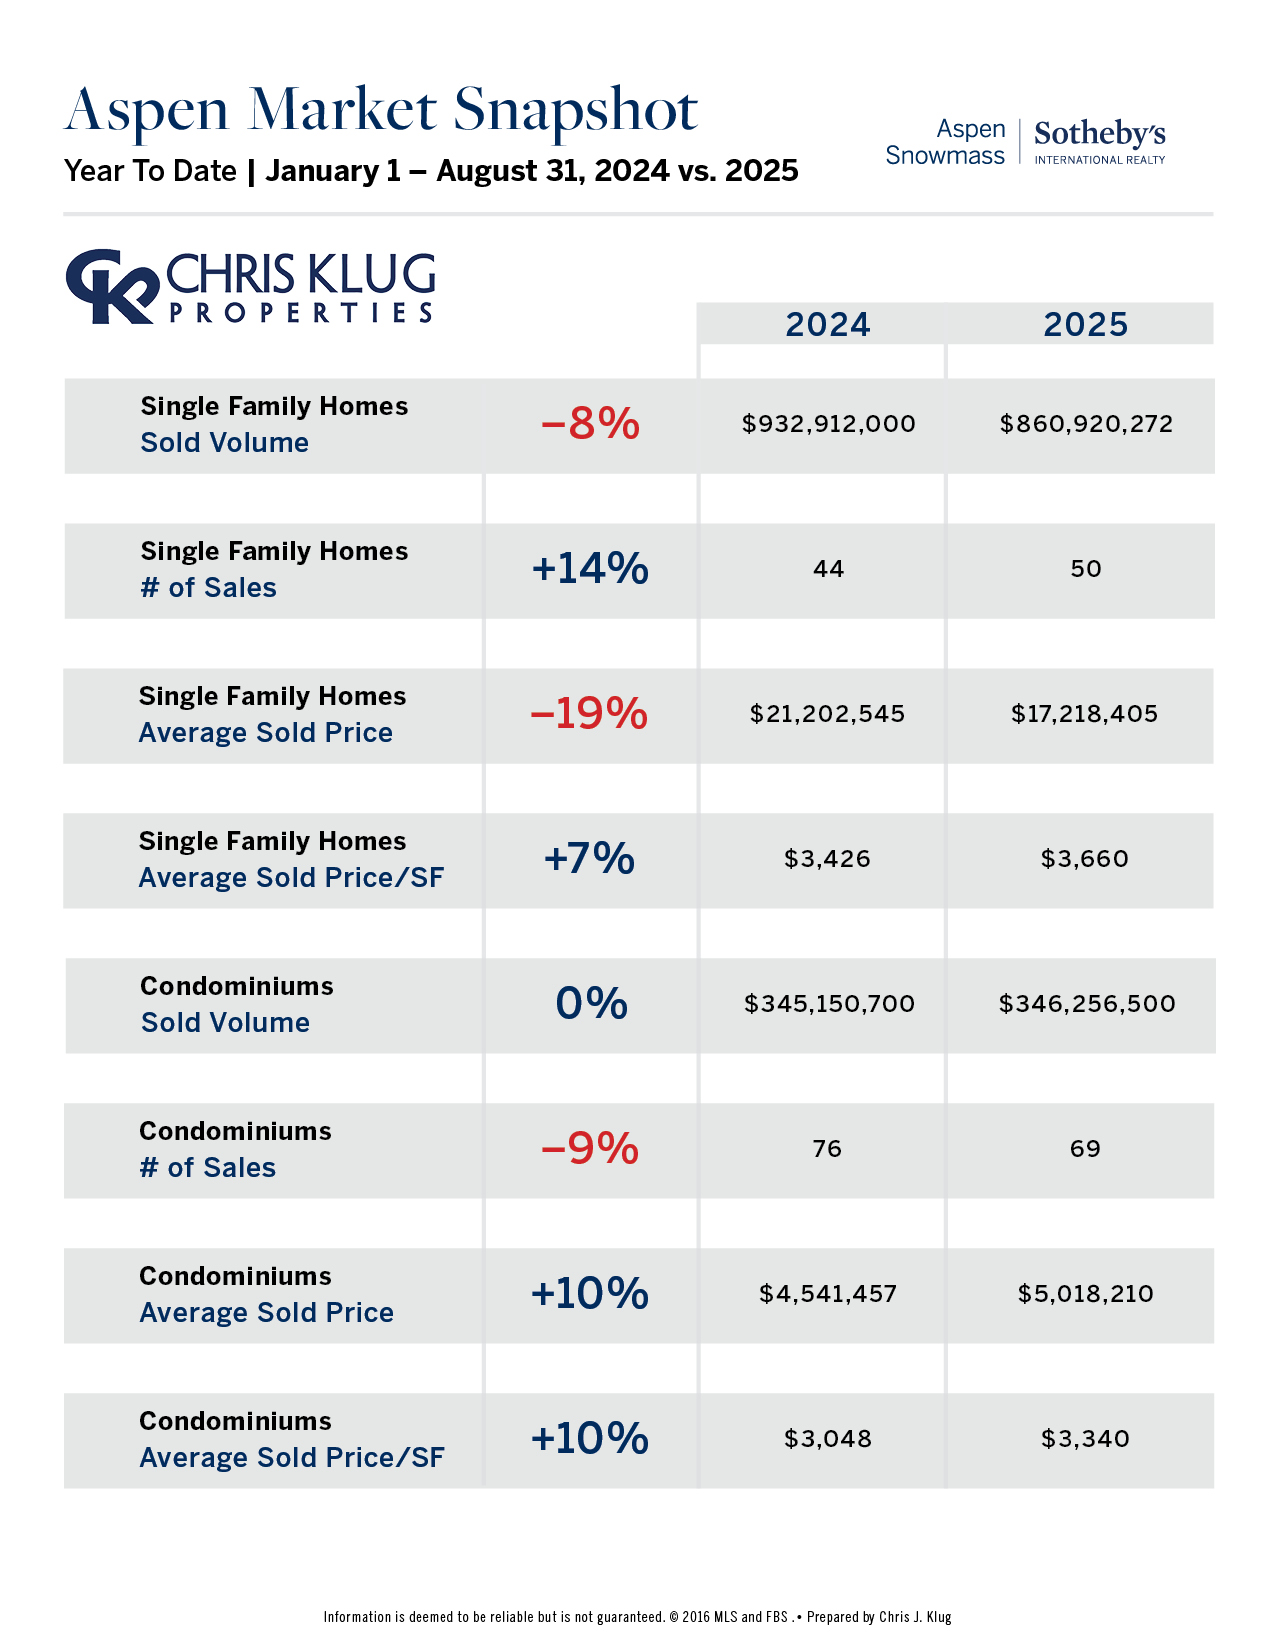
Aspen
Single-Family Homes
YTD sales volume down 8% to $861M (50 sales vs. 44 in 2024).
Avg. sold price off 19% ($17.2M) while $/SF rose 7% to $3,660.
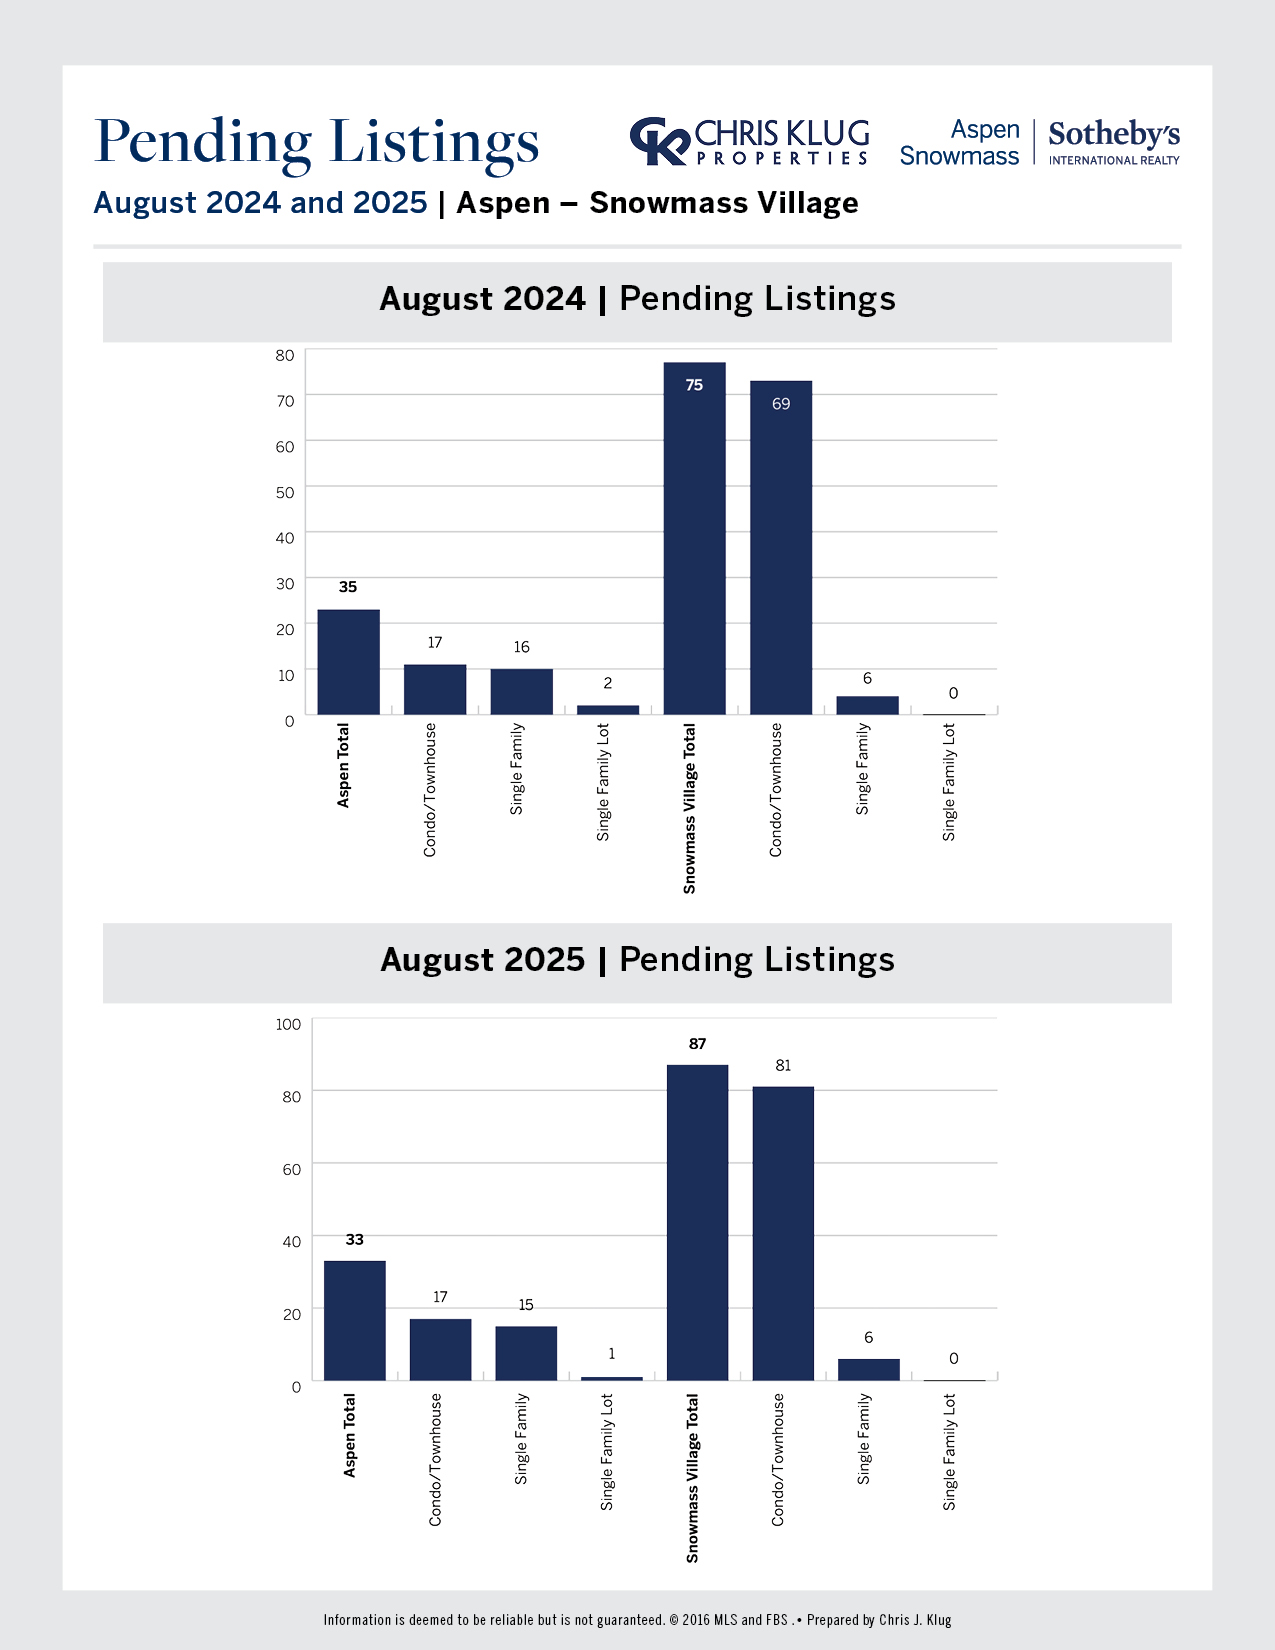
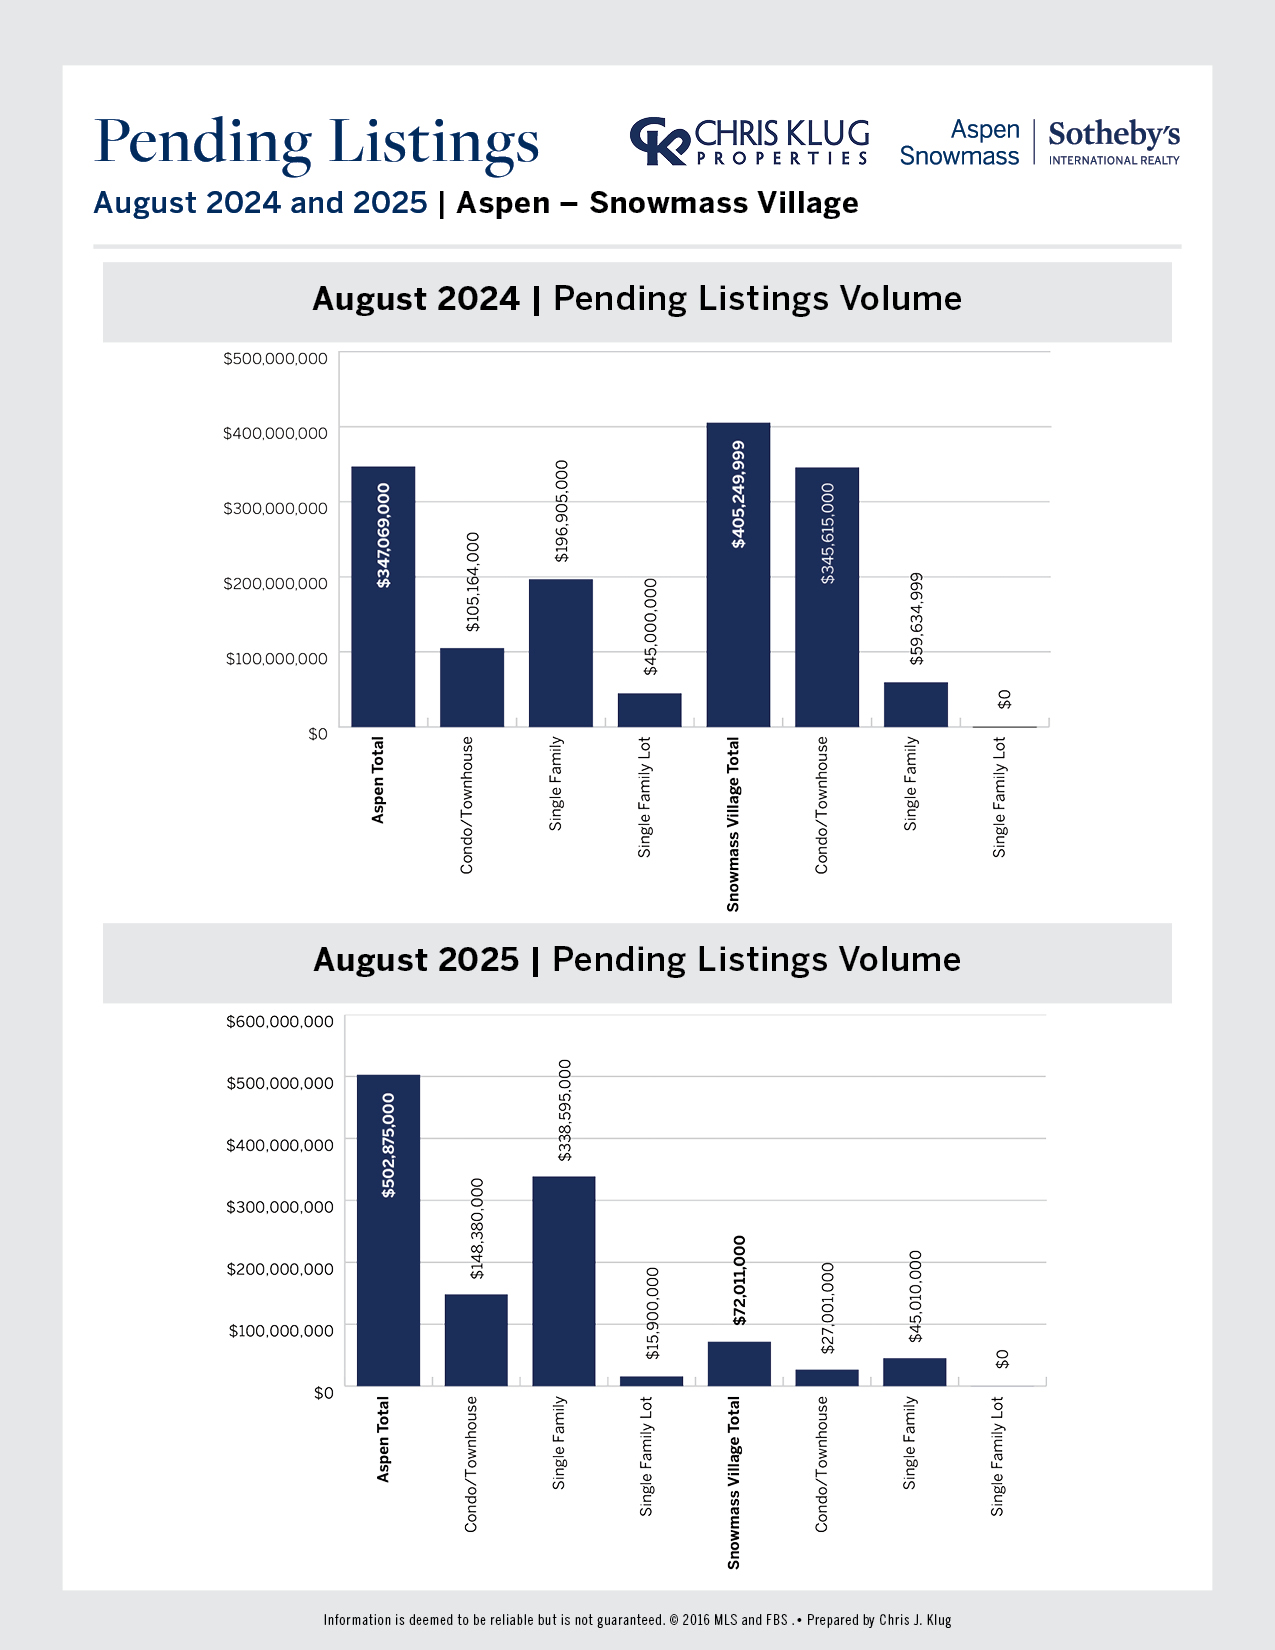
August 2025: 2 sales vs. 6 last year, with volume plunging 90% ($14M vs. $139M) and avg. price falling to $7.0M; $/SF down 19% to $2,660.
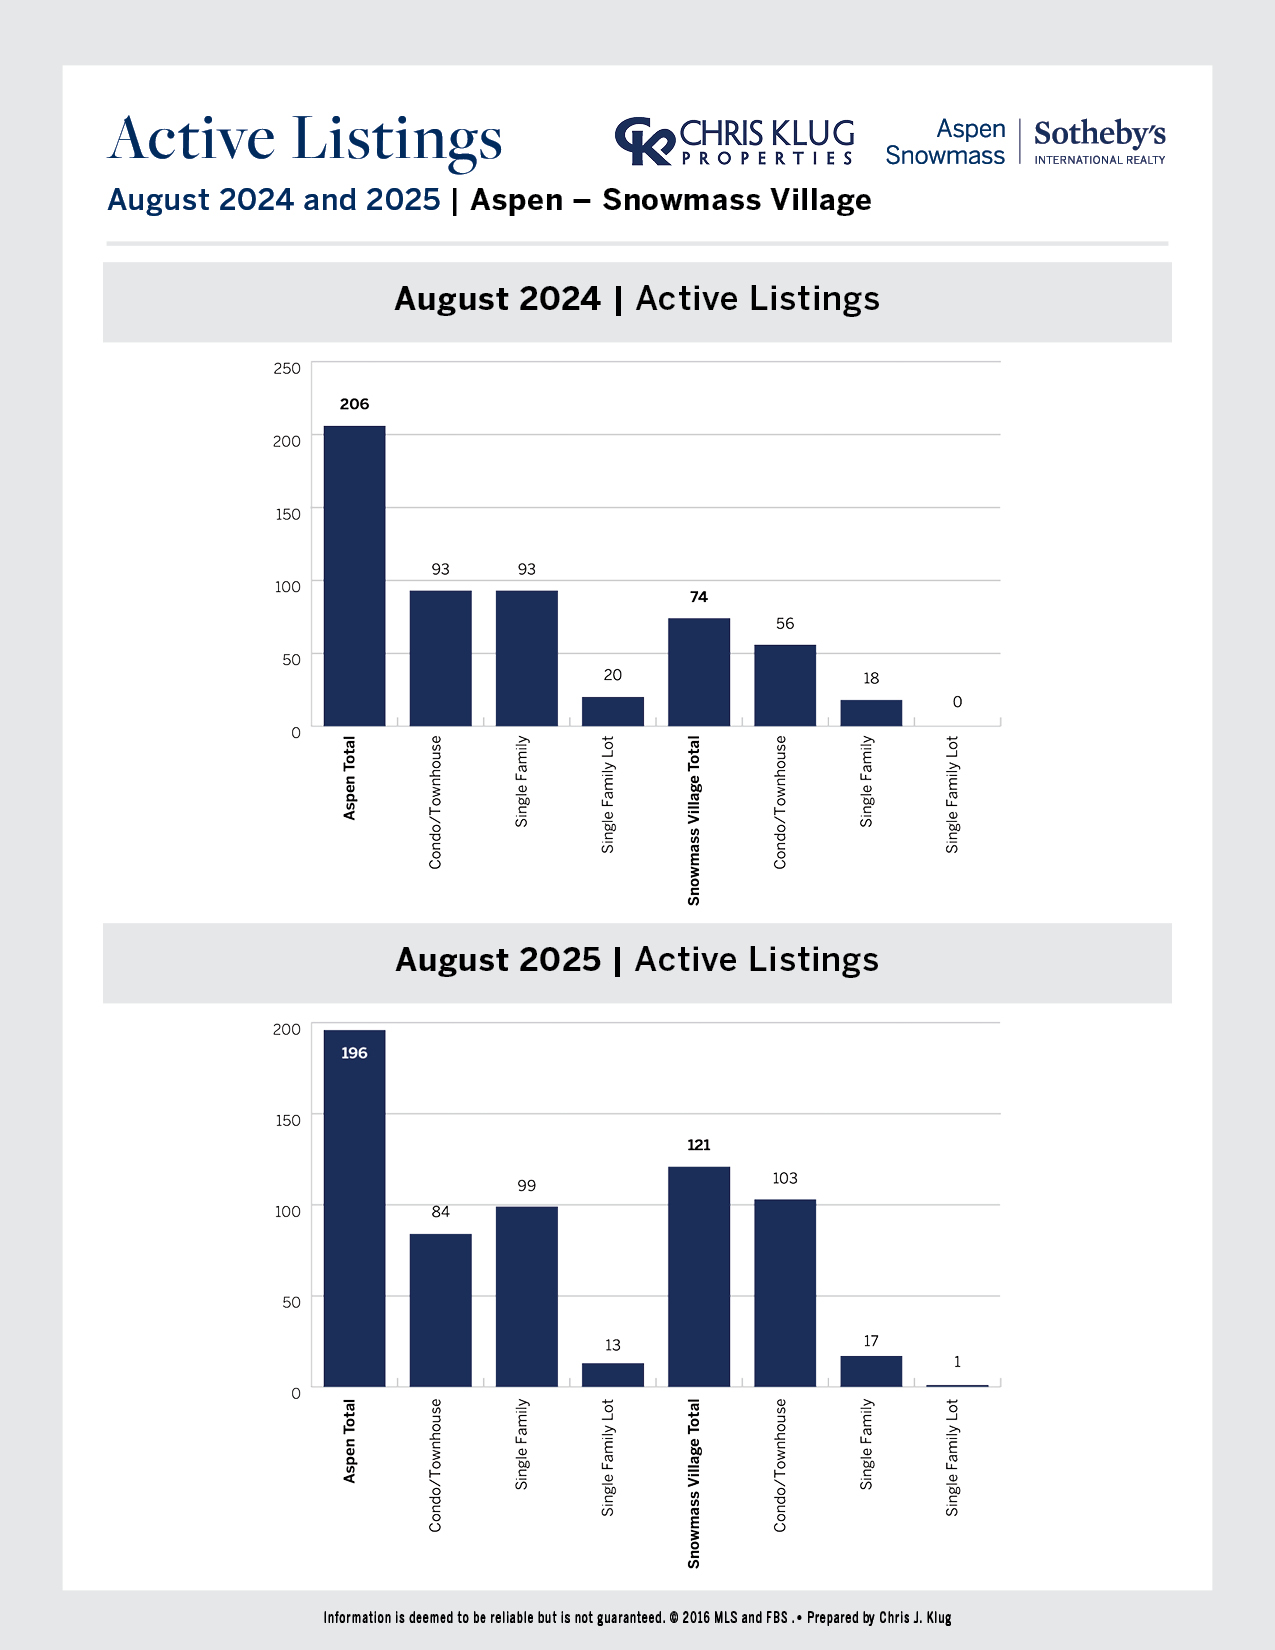
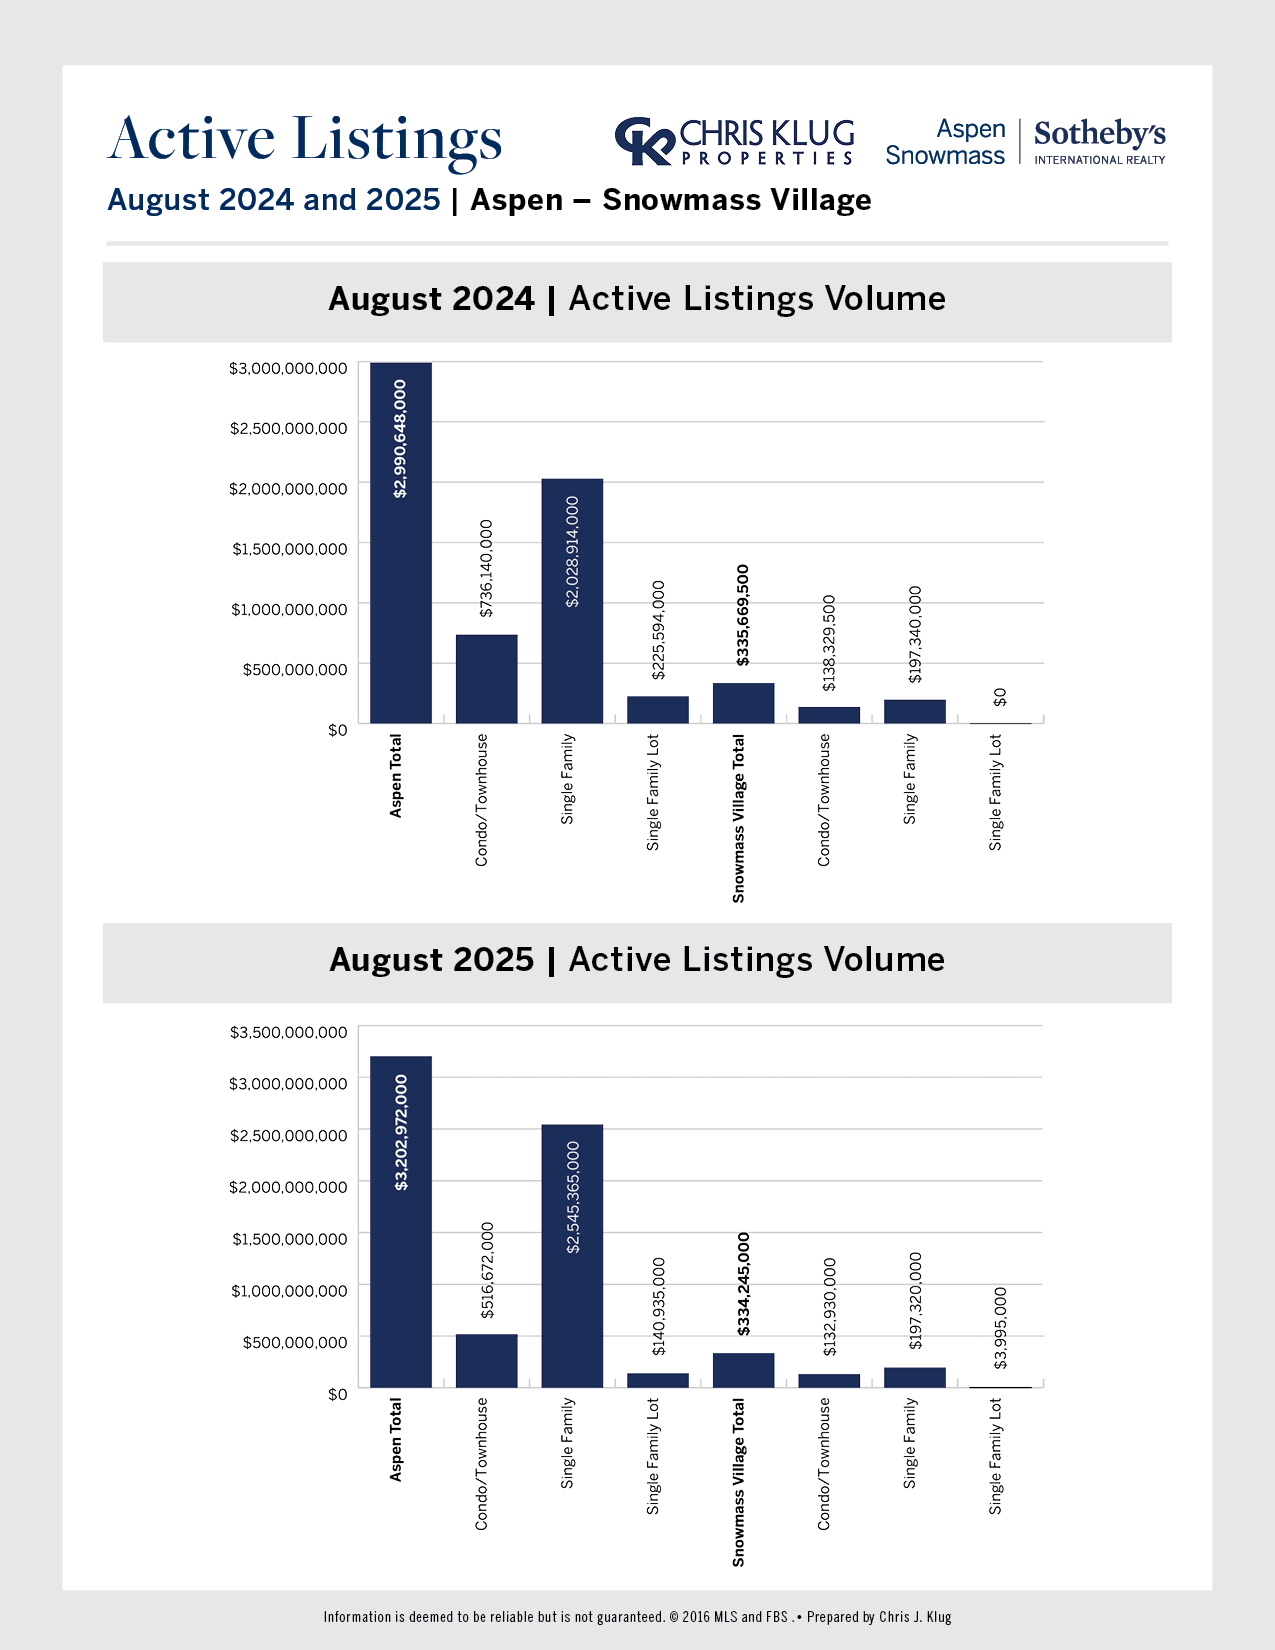
Inventory: 99 vs. 93 in 2024 (+6%) and 147 in 2019 (–33%).
Condos
YTD volume flat at $346M, with 9% fewer sales (69 vs. 76).
Avg. price up 10% ($5.0M) and $/SF up 10% to $3,340.
August 2025: 11 sales vs. 10 last year; volume down 50% ($45M vs. $89M), avg. price halved ($4.1M), but $/SF up 15% to $3,958.
Inventory: 84 vs. 93 in 2024 (–10%) and 95 in 2019 (–12%).
Overall, Aspen Inventory: 196 vs. 206 in 2024 (–5%) and 280 in 2019 (–30%).
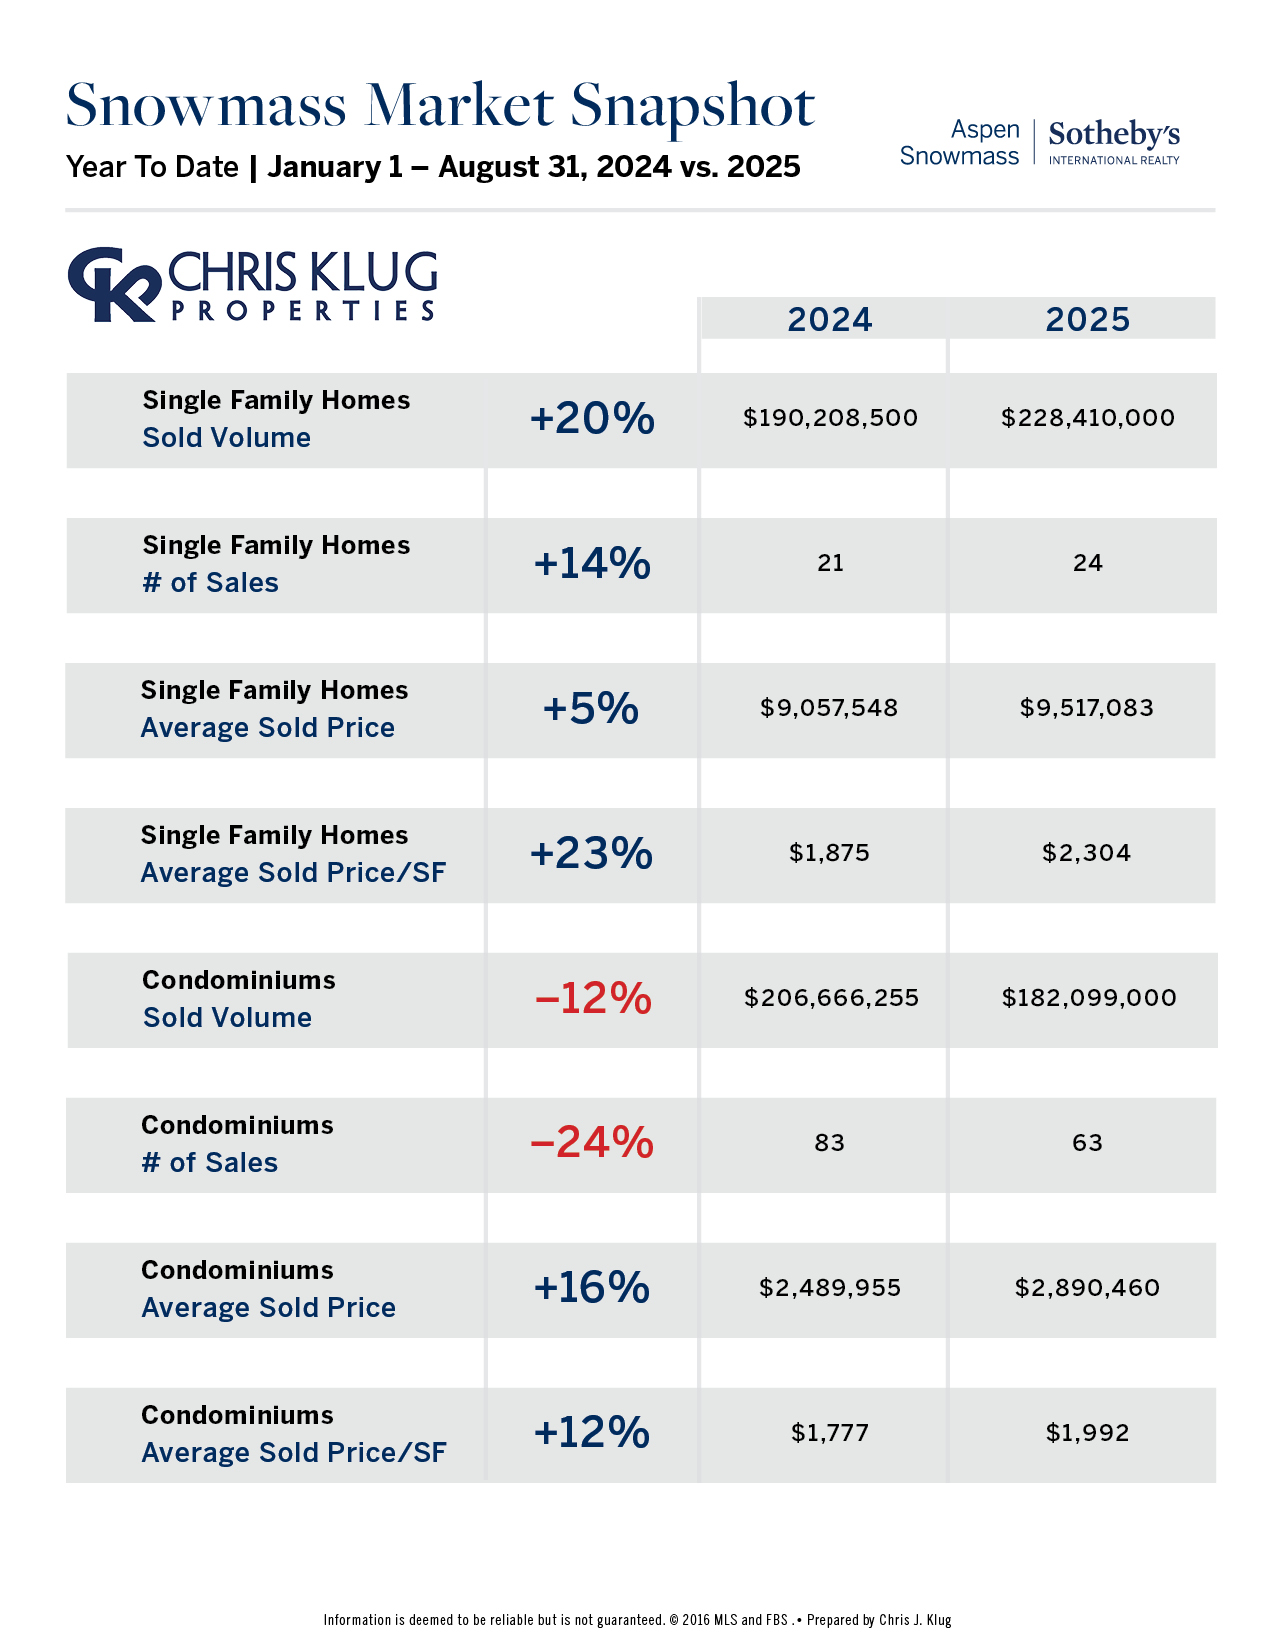
Snowmass Village
Single-Family Homes
YTD volume up 21% to $228M (24 sales vs. 21).
Avg. price rose 5% ($9.5M) and $/SF up 23% to $2,304.
August 2025: 4 sales vs. 3 last year; volume up 60% ($43M vs. $27M), avg. price $10.9M (+20%), $/SF up 28% to $2,538.
Inventory: 17 vs. 18 in 2024 (–6%) and 67 in 2019 (–75%).
Condos
YTD volume down 12% to $182M (63 sales vs. 83).
Avg. price up 16% ($2.9M) and $/SF up 12% to $1,992.
August 2025: 8 sales flat with last year; volume surged 66% ($31M vs. $19M), avg. price and $/SF both up strongly ($3.9M, $2,361, +37%).
Inventory: 103 vs. 56 in 2024 (+84%) and 142 in 2019 (–27%).
Ultra High-End ($20M+)
Aspen continues to command top-tier demand, though August saw fewer mega-closings.
YTD, Aspen single-family $/SF remains near record highs, reflecting continued strength in trophy properties despite thinner overall activity at the very top.